
How to Read a BRUKL Output Document
A page-by-page guide to the report building control reads: the targets, U-values, air tightness, services, solar gain and the data sheet.

How to Read a BRUKL Output Document
The BRUKL output document is the PDF that comes out of an SBEM calculation. It runs to about six pages, and building control reads it to decide whether a new commercial building meets Part L. Most clients only look at the first line. This guide goes through it page by page, using an anonymised as-built BRUKL from one of our recent jobs. In that report the building does not comply, which makes it a useful example.
The header
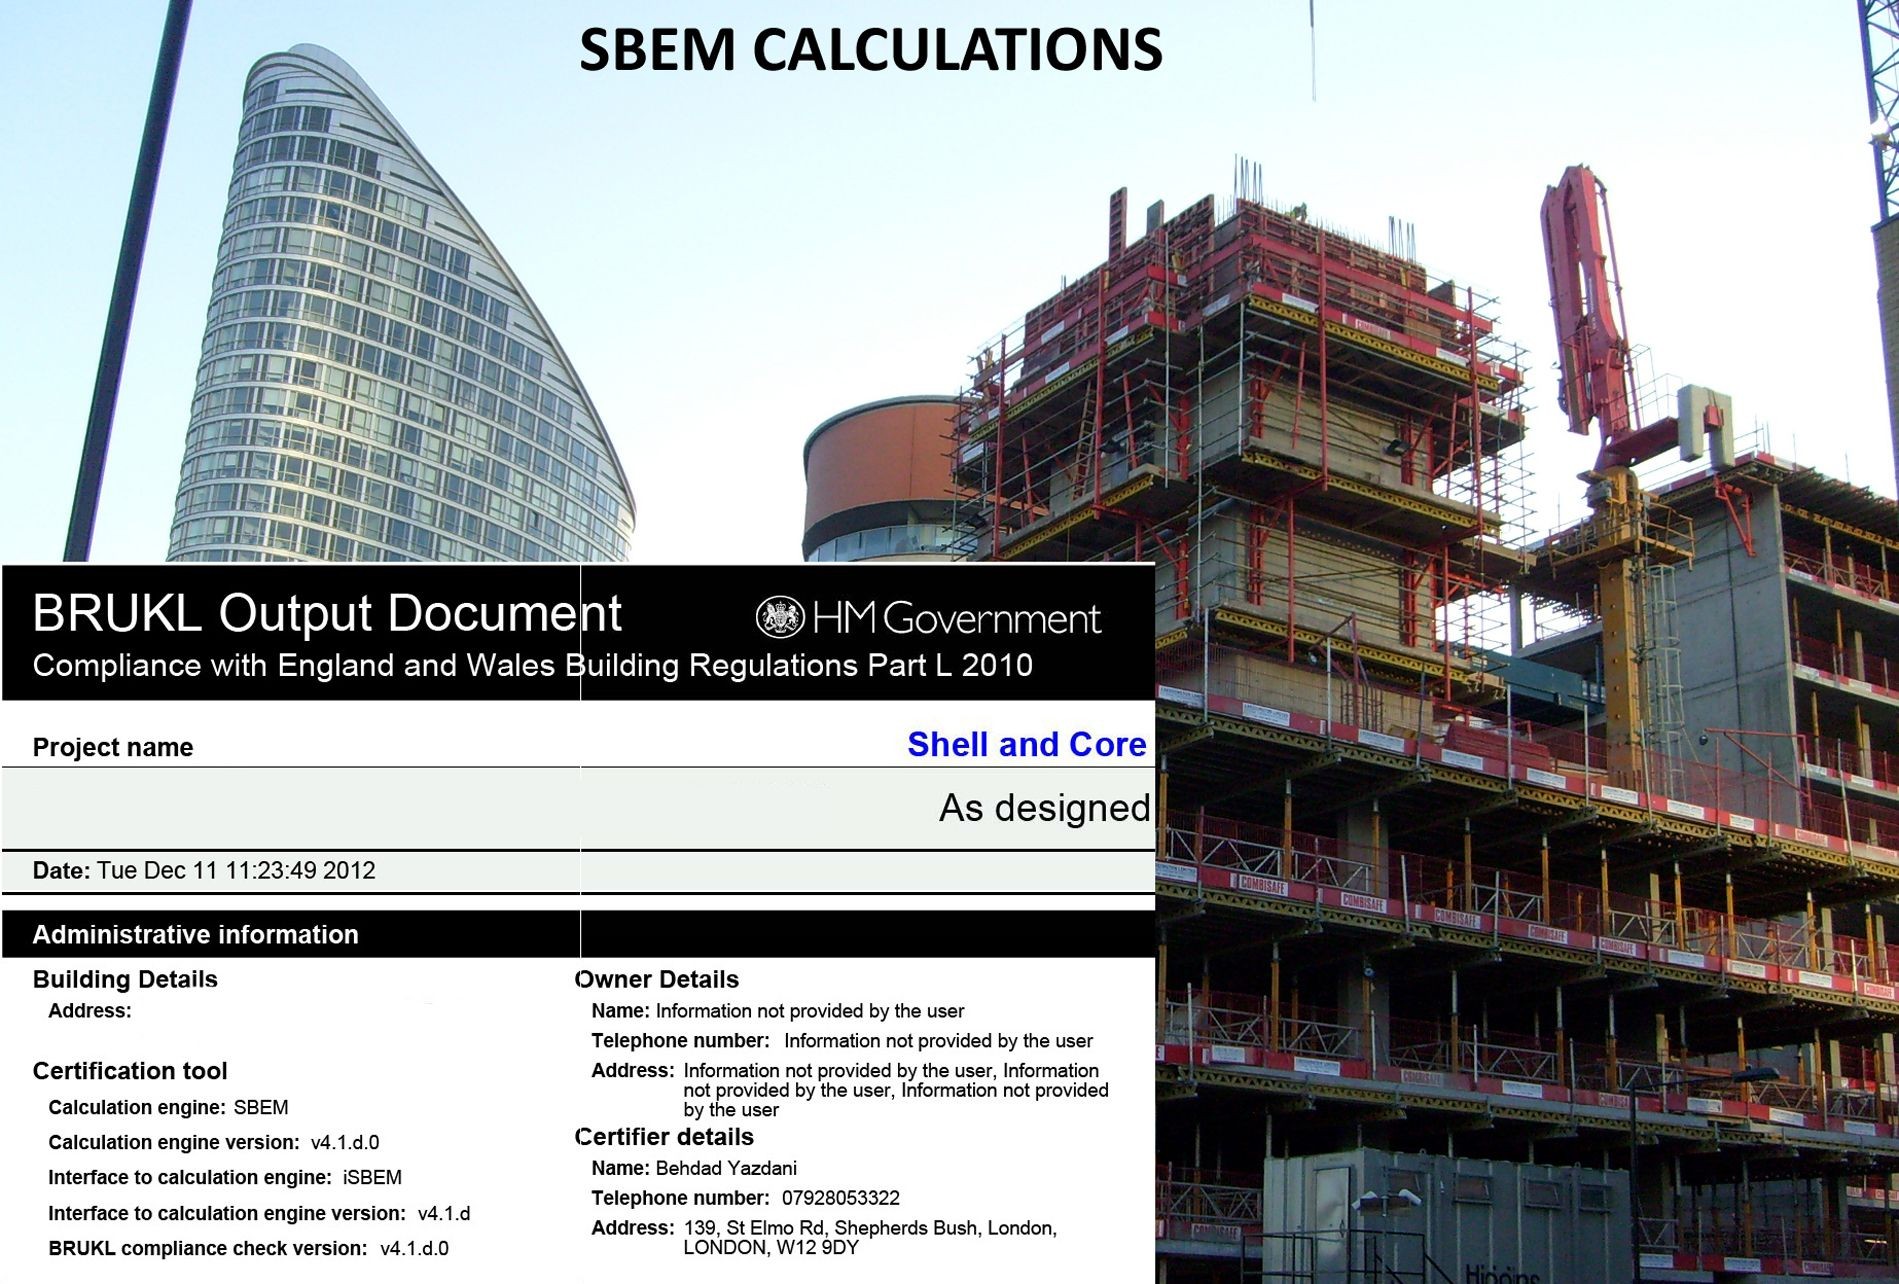
The top of page 1 shows the project, the date, and whether the report is design stage or as built. Check this first. Building control wants the design-stage report before work starts and the as-built report at completion. The header also lists the software (SBEM, the interface used and the version numbers) and the assessor who produced it.
The headline check: carbon and primary energy
Four numbers decide the main result:
- TER, the target CO2 emission rate, and BER, the building's actual rate, both in kgCO2/m2 a year.
- TPER, the target primary energy rate, and BPER, the building's actual rate, both in kWh/m2 a year.
The targets come from a notional building of the same size, shape and use with a standard specification. The BER must not be higher than the TER, and the BPER must not be higher than the TPER. If either is over, the report says the building does not comply and shows "BER > TER" or "BPER > TPER".
In our example the TER is 14.09 and the BER 14.95. The TPER is 151.59 and the BPER 161.48. Both are about 6% over, so it fails on both.
Fabric: the U-value table
The next table compares each type of element with its limit. Ua-Limit is the limiting area-weighted average U-value, Ua-Calc is your building's average, and Ui-Calc is the worst single element. The last column names the first surface with the worst value, which tells you where to look.
The limits printed on a current Part L 2021 BRUKL are: walls 0.26, floors 0.18, pitched roofs 0.16, flat roofs 0.18, windows 1.6, rooflights 2.2, personnel doors 1.6, vehicle access doors 1.3 and high-usage entrance doors 3.0 W/m2K.
In our example the windows average 2.48 against a limit of 1.6, and the floors 0.19 against 0.18.
Air permeability
The limit is 8 m3/(h·m2) at 50 Pa. On a design-stage report this is the design figure. On an as-built report it has to be the tested result. In our example the building is at 10, over the limit, and the model has to use what the air test achieved.
Building services
Each heating and cooling system is listed with its efficiency, fan power (SFP) and heat recovery, next to the standard value. Hot water, zone ventilation and lighting follow. For general lighting the standard is 95 lumens per watt, and 80 for display lighting. There are also yes/no questions on metering, such as automatic monitoring and targeting with alarms.
In our example the heat pumps are well above the standard (4.15 heating efficiency against 2.5), but some rooms have lighting at 90 lm/W, below 95.
Solar gain
Each zone shows whether its solar gain limit is exceeded, as a percentage. "NO (-70%)" is comfortably inside. "YES (+146%)" means the room takes in far too much sun. In our example two meeting rooms are flagged, at +146% and +179%. The usual fixes are solar control glass, external shading or less glazing on that side.
Regulation 25A
Three yes/no questions ask whether high-efficiency alternative systems, such as heat pumps, heat networks or solar panels, were considered, and whether the evidence is available. Building control may ask to see it.
The technical data sheet
The last pages compare the actual building with the notional one: air permeability, average U-value, energy use by heating, cooling, auxiliary, lighting and hot water, energy produced by solar panels and other technologies, and each HVAC system's performance. This is where you find out why a building fails.
In our example hot water is the largest use at 75 kWh/m2, and the notional building gets 4.84 kWh/m2 from solar panels that the actual building does not have. Those two lines explain most of the gap.
If your BRUKL fails
Do not redesign blindly. The data sheet shows which end use is pulling the result over. The usual levers are the hot water system, a small solar PV array, the glazing specification, a better air test result and lighting efficacy. We model the options and tell you which costs least to pass.
SBEM calculations start from £400+VAT per building, including the BRUKL report and the EPC. Turnaround is 3 working days for small commercial buildings and 5 for larger ones.
Questions we get asked
Is the design-stage BRUKL the same as the as-built one? No. The as-built report uses what was actually installed and the tested air permeability. The header says which one you have.
Our BER passes but the U-value table shows red. Is that a problem? Usually, yes. The carbon and energy targets are the headline check, but the limiting U-values, air permeability and services standards are minimum standards in their own right, and building control will query them.
Can you check a BRUKL someone else produced? Yes. Send us the PDF and we will tell you what is failing and why.
Do we need a separate EPC? For a new building the EPC comes from the same as-built SBEM model, so we produce both together.
More: What is a BRUKL report?, SBEM calculations and BRUKL reports, SAP or SBEM, air tightness testing, commercial EPCs
Send Us Your Drawings
Send us your BRUKL or your drawings and M&E specification. We will tell you where your building stands, with a quote and a turnaround time.